

If you want to grab the attention of readers and journalists – and attract links – then your content must be exciting, eye-catching, and unique and data journalism is the easiest way to create content that stands out from the crowd.
Basing your content on statistics and facts about engaging topics ensures that you’re creating content that is interesting, newsworthy, and sharable. And it should also help drive more traffic to your site.
One of the coolest things about creating your own proprietary data is that it’s kind of reminiscent of playing “Jeopardy!” The thoughtful questions, simple responses, and the basic simplicity of being the first to have the knowledge.
Be the Source
Creating your own data for an article is typically one big headache.
If you’ve ever tried to survey customers, you know what I’m talking about.
But, as SEJ’s own Loren Baker says, “Be the source.”
When you create your own data, people will want to link back to the place they cited.
Using tools like Google Trends and Google Consumer Survey, you can search for trending topics and build your own data.
Pick Your Topic
Good data doesn’t always equal good content.
You have to figure out how to tell a story with the data you have.
First, you must decide what your content is going to be about.
With data, this can be a chicken and egg situation – do you use the data you have to form your topic or do you choose your topic and then collect some data around it?
It may depend on whether you have pre-existing data or whether you already have a subject matter in mind that’s newsworthy or trending.
When researching what topics I may want to cover, I’ll start researching with Google Trends and BuzzSumo. These tools are built for research and exploring trends.
Gather Your Data
The first step to creating data-driven content is to actually find the data.
I begin to gather my resources of data, whether I’m surveying users or using my own data.
Important note: When building content with your own proprietary data, it’s not about quantity. Traditional content strategy suggests more content equals more leads, but that’s not true. You only need one major piece of killer content to achieve your goals.
- Conduct Surveys
The go-to place for collecting fresh data, surveys are a fantastic way to gather information and to get statistics and data around subjects that you specifically want to focus on.
Think carefully about your questions before asking them. You want to get the best results possible to generate a variety of angles for you to use in your content.
Make sure your questions will support your story and limit the number of open-ended questions you ask. Include a variety of demographic questions so that you can cross-reference answers given with details about the respondents. This will allow you to create multiple sub-stories and angles to push out to local press.
- Ask Your Community
Do you have your own community of customers or fans? Then ask them a few questions or send out a questionnaire!
If you work for a bigger brand and have forums where your customers come together to discuss a range of different topics, this is a great place to start a conversation about the topic you want to create content around.
Many businesses also have a large database of customer contact details and some regularly send out newsletters. An easy way to obtain data is to send this database a set of questions or forms to fill in via email and reward them with a discount code or entry into a prize drawing once they have returned their answers.
If you have a large social media following, you can use Facebook and Twitter polls to gather data.
Or simply run a competition on your site to find out the information you need using a data capture system as a form of entry.
- Use Your Own Data & Reports
Many SaaS companies don’t realize the amount of data they are already sitting on.
You likely have some analytical tools to track the success of your own website and marketing efforts. These tools could be used to give you useful insights and data you could use as part of your content marketing strategy.
Google Analytics is a good place to start, as you can look into different consumer demographics such as their age, gender, and location of your customers, along with the industries they work in, what they buy, what devices they use, and more.
Look for Interesting Angles
Once you’ve got your data, you need to analyze it and pull out the angles you want to use to tell your story and make your content as newsworthy as possible.
Analyzing data isn’t always easy, especially if you find yourself staring at a huge spreadsheet of numbers and stats.
Try and highlight any key points and statistics that support the storyline or headline you want to use and pull out any compelling insights in your results. Use conditional formatting and create pivot charts to find correlations between different data sets, and if you don’t get the answer or result you were hoping for, don’t force it — put it to one side and focus on a different angle.
Once you have some strong data in front of you, segment your results demographically. This will help you find a range of local angles you can pull out for your content based on gender, age, location etc. – perfect for pushing out to regional press and publishers for extra coverage.
Visualize Your Data
The way you present your data is key to the success of your content.
Data visualization is the first step of making your content engaging and shareable. But it isn’t easy.
Ideally, you should work with a designer to visualize your data. But if you don’t have access to one (or don’t have the budget), you can make it yourself using a data visualization tool.
Once you’ve created your visual, you need to make sure there is still some content around it to tell your story and make your data come to life. Always keep in mind how you want your readers to digest your content and that it needs to be responsive on mobile and tablet devices.
How to Structure Your Content Support Activities
If the content is truly a unicorn, as Larry Kim would say, you need to do all the supporting activities around this piece.
Here’s how I structure my content support activities:
- Collaborate with the PR team to create a strategy. PR teams develop some of the highest-quality link opportunities, but they leave a lot of opportunities on the table. This is where link builders come in to do the manual outreach.
- Conduct manual outreach to industry blogs for backlinks and guest blogs.
- Partner with other companies on a webinar to discuss the data.
- Create a blog post series to give further context to the data and optimize for new search terms.
- Utilize the data in presentations at conferences.
- Recreate the data in infographics, charts, and graphs.
Awesome Examples of Data-Driven Content
Here are a few pieces of data-driven content to inspire you:
The Guardian has really taken the lead with data visualization and has a whole section on their site dedicated to it. It’s a great place to go for inspiration on how you can shape your data into eye-catching graphics.
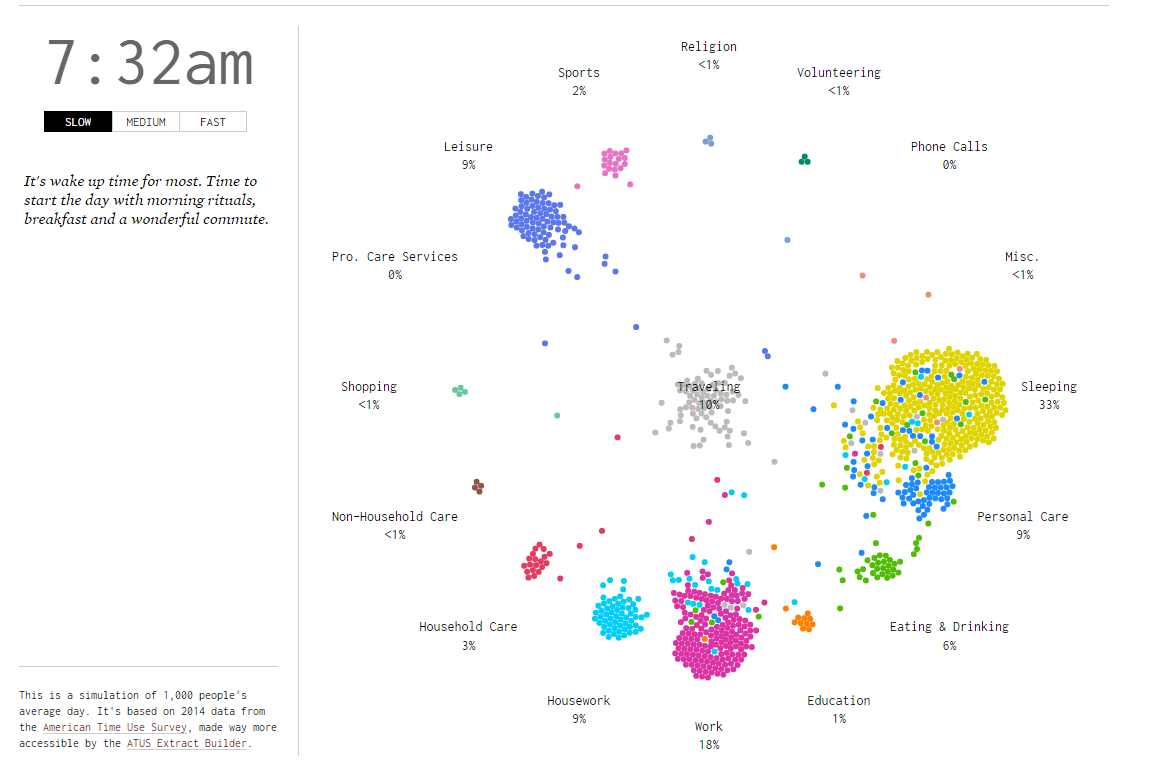
Here’s another really cool example of some data visualization based on A Day in the Life of Americans:
Don’t Have Any Data?
Don’t have time to collect data yourself?
No problem!
There are plenty of data sources you can use and combine to make a whole new data set.
For example, you could take two similar data sets that were created 10 years apart and then compare and contrast them.
Or, you could analyze someone else’s data and pull out some new angles that haven’t been used yet.
Here are some other resources to find some interesting data to use in your content or as a starting point for a bigger piece of data journalism:
- Pew Research Center
- Wikipedia
- Google Scholar
- The Office for National Statistics
- Reddit’s Data is Beautiful subreddit
You can also simply type into Google “[keyword] market research” or “[keyword] data sets” to find a range of different information available online.
Read this article for a case study and even more ideas: Building Links with Data-Driven Content (Even When You Don’t Have Any Data)
Credit: Search Engine Journal